 | ||
| || home ||| units ||||| help | ||
| All Units | > | Unit 11 - Air pressure | > | Investigation 2 - Air pressure and the lungs | > | Analysis |
Analysis
-
How did using a model help you better understand what is happening when you breathe?
-
Using your chest cavity and lung model, someone created the following graph by measuring air pressure in the "chest cavity." What is a possible explanation for the graph?

The "diaphragm" balloon was pulled down quickly and then released. The "diaphragm" balloon was pulled down slowly for about 15 seconds then pulled down further quickly and held for 10 seconds, and then released. The "diaphragm" balloon was pulled down quickly, held, and then released over a period of 12 seconds.
-
A sealed syringe contains 3cc (cubic centimeters) of air at 102kPa (atmospheric pressure at sea level).
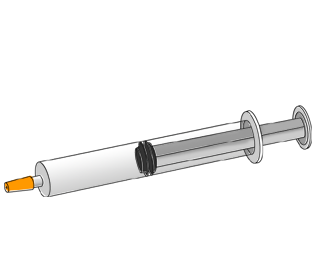
The plunger is pulled out until the pressure in the syringe drops to 80kPa. What is the volume of the air in the syringe?

If the seal is taken off the end of the syringe, what will happen?
 |  |  |
Copyright 2005 The Concord Consortium, All rights reserved.