
Technical Hint - Using the Graph Sketcher

- Press the Graph Sketcher button. Use the cursor to sketch a graph.
- If you want to start over, press the Clear button to erase your graph and start over.
Additional Tools in the Tool Palette
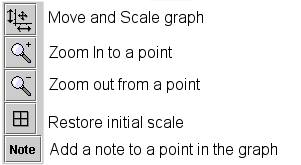
Move and Scale graph. This tool has two functions. If you are holding the cursor over the data in the graph, you can click and drag to move the data around to view different parts of the data set. If you are holding the cursor over the X or Y axis, you can click and drag to change the scale.
Zoom In to a point. This tool allows you to zoom in on a data set. Go to the point where you want to zoom in and click.
Zoom out from a point.This tool allows you to zoom out on a data set. Go to the point where you want to zoom in and click.
Restore initial scale. Clicking this tool restores the initial scale.
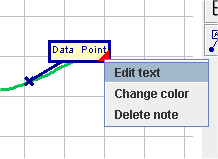
Add a note to a point in the graph. When you select this tool, you can add a note to a specific point on the graph. Move the cursor over the point you want to note, and click. A box will appear. To edit the box, click on the triangle in the lower right hand corner. Other options will appear. You can edit the text in the box, change its color or delete the note by selecting the option from the drop down menu.

Copyright 2005 The Concord Consortium, All rights reserved.