 | ||
| || home ||| units ||||| help | ||
| All Units | > | Unit 12 - Motion | > | Investigation 2 - Displaying changing velocity | > | Trial 2 |
Trial 2 - Speeding Up?
-
Observe the graph below.
Write a short description for the graph that tells the story of the movement. Be sure to include numerical information about the direction of your motion, the speed of your motion, and your distance from the starting point when changes in direction and speed occurred.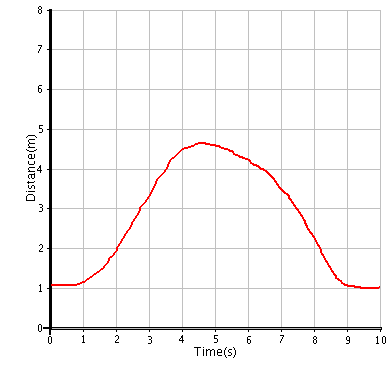

-
With your back to the motion sensor, try to reproduce the graph from your description. Refer to Technical Hints to connect the motion sensor. Refer to Technical Hints to record a series of measurements. Repeat until you capture the desired graph. Save the graph. Refer to Technical Hints to save data.

-
Now that you have experienced the needed changes in velocity to reproduce the graph, select the letters from the graph shown above to identify the following motions. Write a short justification for each selection.
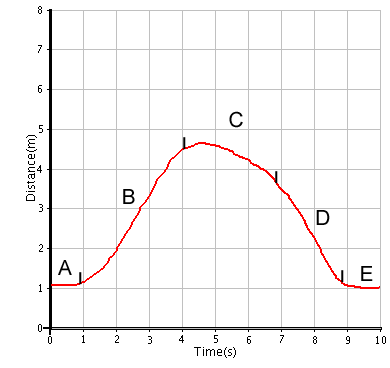
I. no movement
II. moving at same or constant velocity
III. changing velocity
IV. increasing velocity
V. decreasing velocity
-
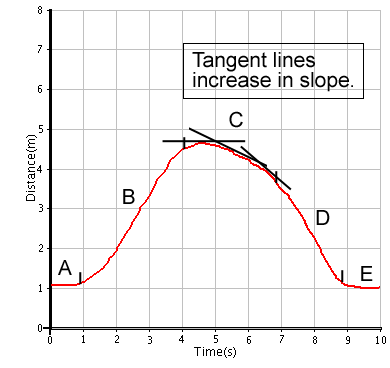
Based on your explanation of the graph, do you agree that a straight line shows constant velocity?
-
Why would changing velocity, otherwise known as acceleration, be shown as a curve on the graph? The black lines, called tangents, meet the curve at a single point and show the slope of the curve at that point. Notice that the tangents are constantly changing in slope.
 |  |  |
Copyright 2005 The Concord Consortium, All rights reserved.