 | ||
| || home ||| units ||||| help | ||
| All Units | > | Unit 1 - Sound | > | Investigation 1 - Exploring sound | > | Trial 2 |
Trial 2 - Explore Loudness and Pitch
-
Connect a microphone to your computer if there is none built in. Refer to Technical Hints to connect the microphone. Start the sound grapher. Refer to Technical Hints to use the sound grapher.

-
Hum into the microphone. Try changing how loudly you hum. How does the graph change to show you how loud the sound is?

-
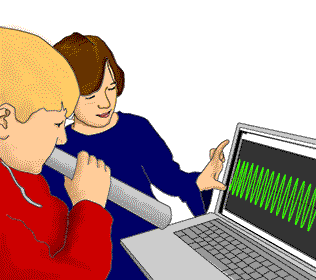
Make a tube by rolling up a piece of paper. Refer to the picture below. Start the sound grapher. Refer to Technical Hints to use the sound grapher. Put one end of the roll near the microphone and hum into the other end. Does this make the sound louder in the Sound Grapher? Why do you think this happens?
-
Start the sound grapher. Refer to Technical Hints to use the sound grapher. Make the same sound close to the microphone, then farther away. What changes do you notice in the graph? Does the loudness decrease as you move farther away? Why do you think this happens?
-
Start the sound grapher. Refer to Technical Hints to use the sound grapher. Listen to these two sounds. The first is lower in pitch and the second is higher in pitch. Play the two sounds and observe them in the sound grapher. Keep the picture of the sound by hitting Stop.
-
Find the repeating pattern in each sound. Count how many times the pattern repeats in the graph.
Number of times the pattern repeats:
Lower pitched sound:

Higher pitched sound:
-
Start the sound grapher. Refer to Technical Hints to use the sound grapher. Hum into the microphone and try to change the pitch. As the pitch goes up, the repeating pattern should get closer together.
-
Start the sound grapher. Refer to Technical Hints to use the sound grapher. Hum a low pitch. Keep the picture of the sound by hitting Stop. Then hum a high pitch. Keep the picture of the sound by hitting Stop. Find the repeating pattern for each pitch. Draw a picture of the repeating pattern. Refer to Technical Hints to use the drawing tool. Count the number of times each pattern repeats, and write it in the box below your drawing.
Drawing of the lower pitch

Number of repeats of the pattern
Drawing of the higher pitch
Number of repeats of the pattern
-
Count how many times the pattern repeats on the screen.
Number of times the pattern repeats:
Lower pitched sound:
Higher pitched sound:
-
Your data appears below. How does the number of times a pattern repeats affect a sound's pitch?
Pitch Picture How many repeats Lower Higher
-
Have one person make a uuuu sound and another person whistle. If you can't whistle, find someone in the class who can. Which sound has the higher pitch? How can you tell? Record your findings below.
-
Start the sound grapher. Refer to Technical Hints to use the sound grapher. Make both the uuuu sound and the whistle into the microphone at the same time. Keep the picture of the sound by hitting Stop. Can you see the patterns for both sounds at the same time in the sound grapher? Record you findings below.
-
Draw the pattern. Refer to Technical Hints to use the drawing tool.
-
What part of the pattern you recorded is the whistle? What part of the pattern is the uuuu sound? Describe below.
The sound grapher is a picture of the sound frozen in time. The pattern for the higher-pitched sound is closer together and happens faster. This is what 'pitch' means. It is a measure of how fast the sound vibrations are happening.
Another word for how fast the sound vibrations are happening is 'frequency'. For higher-pitched sounds, the vibrations happen faster or more frequently, so they have a higher frequency.
 |  |  |
Copyright 2005 The Concord Consortium, All rights reserved.